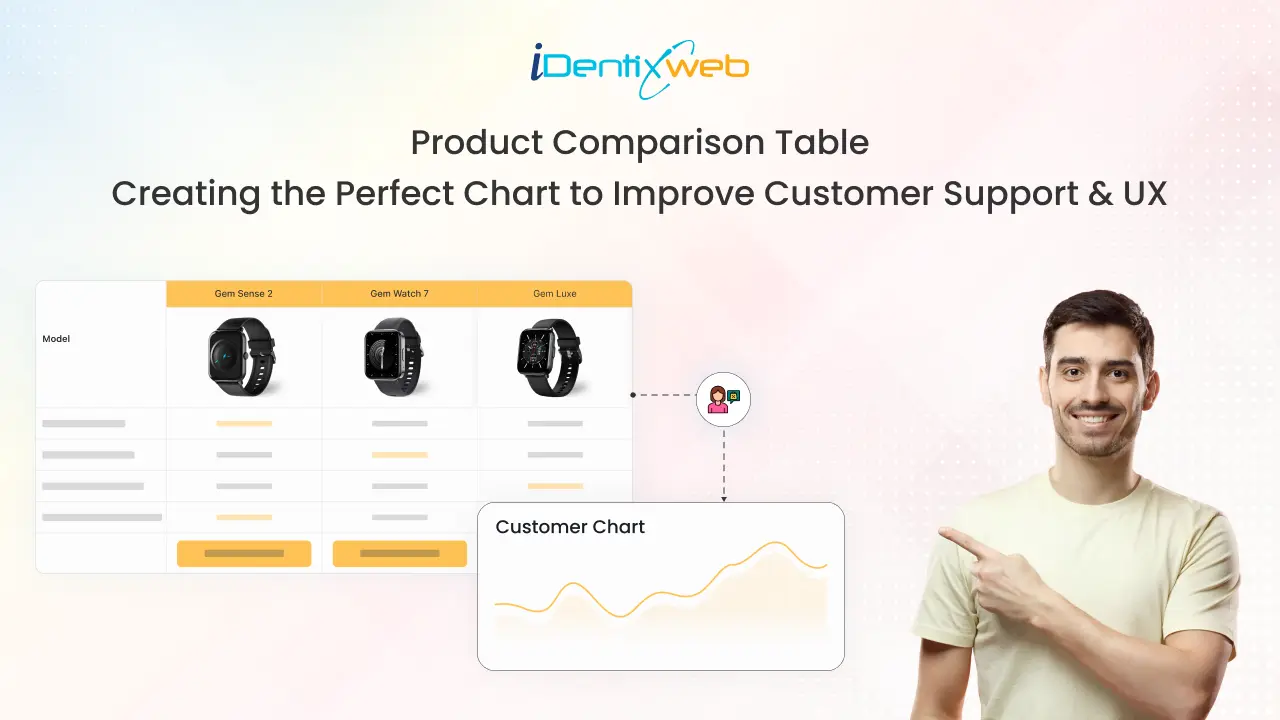
Choosing between similar products is stressful for online shoppers. They navigate through different product pages and waste time comparing the best one to choose. A product comparison table can solve this problem.
When customers shop in physical stores, sales consultants are available to assist customers in comparing and selecting products. But what about online shopping?
A product comparison chart, as the name suggests, has the relevant product information in a tabular form. But how do I add this solution to my product page, or better yet, what should I keep in mind before creating one?
Let’s learn about comparison charts today. We will understand its types, why to add comparison tables to your store and tips to create a great one that helps increase sales.
What is a Product Comparison Table in E-commerce?
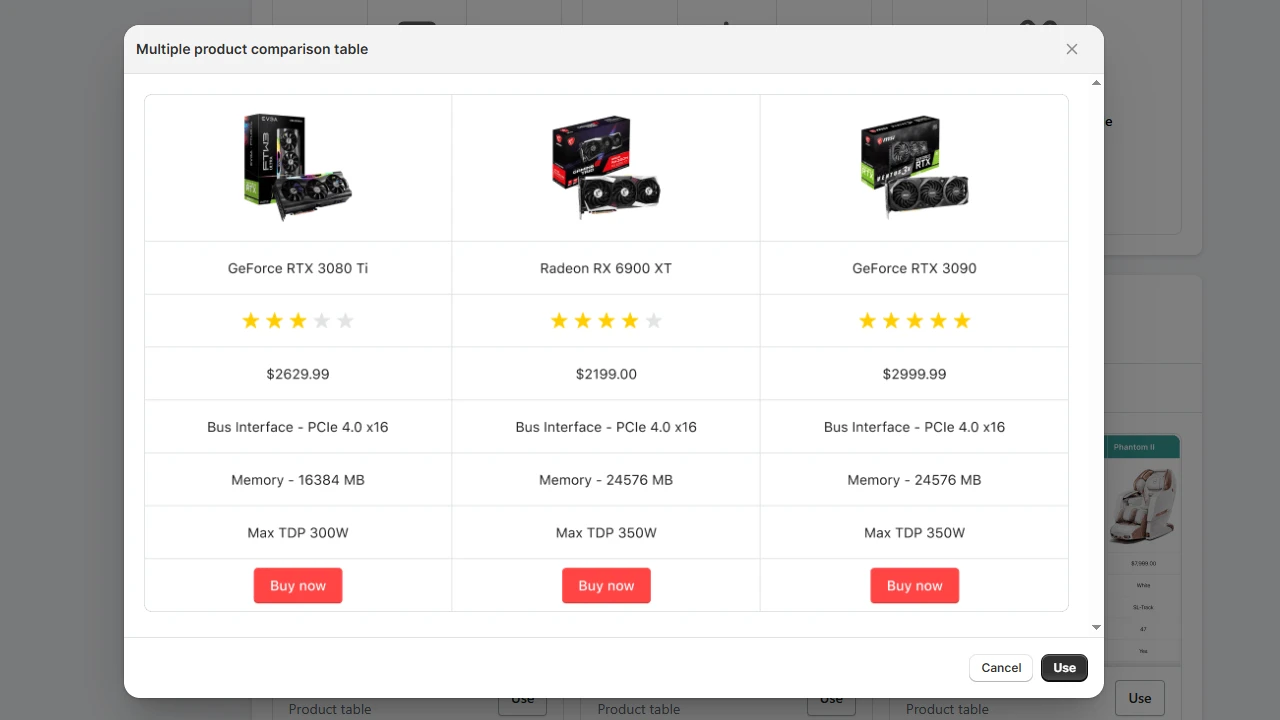
The product comparison table is a visual representation of similar products in the form of a spreadsheet. It is also known as a product comparison chart. The products are listed in columns, and the features are listed in rows.
A product comparison chart created on TablePress, the Shopify application
It is also worth noting that the descriptions in the comparison table differ from the product descriptions. While product descriptions are more detailed, details in comparison tables are short and brief.
Now, let’s understand why we should add a comparison chart to your online store.
Why Add a Product Comparison Chart to Your Online Store?
Enhanced Shopping Experience
Quick access to information is a key feature of a good website. Comparison tables help customers get the information they want in no time with just a few clicks.
Comparison charts provide a single view of information about similar products. This helps customers to make informed decisions quickly, providing a seamless shopping experience.
Direct Conversions from Table
Adding a CTA option in the product comparison table will help merchants with conversions. For example, if you added a ‘Buy Now’ option to the comparison table, it will enable the customers to add the item immediately to the cart.
Reduces Support Requests
Instead of reaching out to customer support to ask, “What’s the difference between Product A and Product B?”, customers can quickly see the comparison for themselves. This saves time for both customers and your support team.
Additionally, comparison charts help reduce miscommunication after purchase. When expectations are set upfront, there are fewer cases of refund requests.
Keeping Users on Your Store
To compare multiple products, users need to visit different product pages. By adding a product comparison table to your online store, you can keep users on your site as they don’t have to move back and forth.
Let’s understand more about comparison tables by going through their different types.
Types of Product Comparison Chart
Product Comparison Table: Static and Dynamic
This is the most common type of comparison table, where product information is displayed in a straightforward manner. However, there are two types of comparison charts: Static and dynamic.
Static Product Comparison Chart
Here, the data remains static, and the user cannot add or remove any descriptions. This is useful, particularly for comparisons where less info needs to be displayed and there are no frequent changes.
Dynamic Product Comparison Chart
Here, the customer has the choice to add or remove different descriptions based on the product to make a personalized table. This is useful when you have many products with a long list of features.
Size Chart
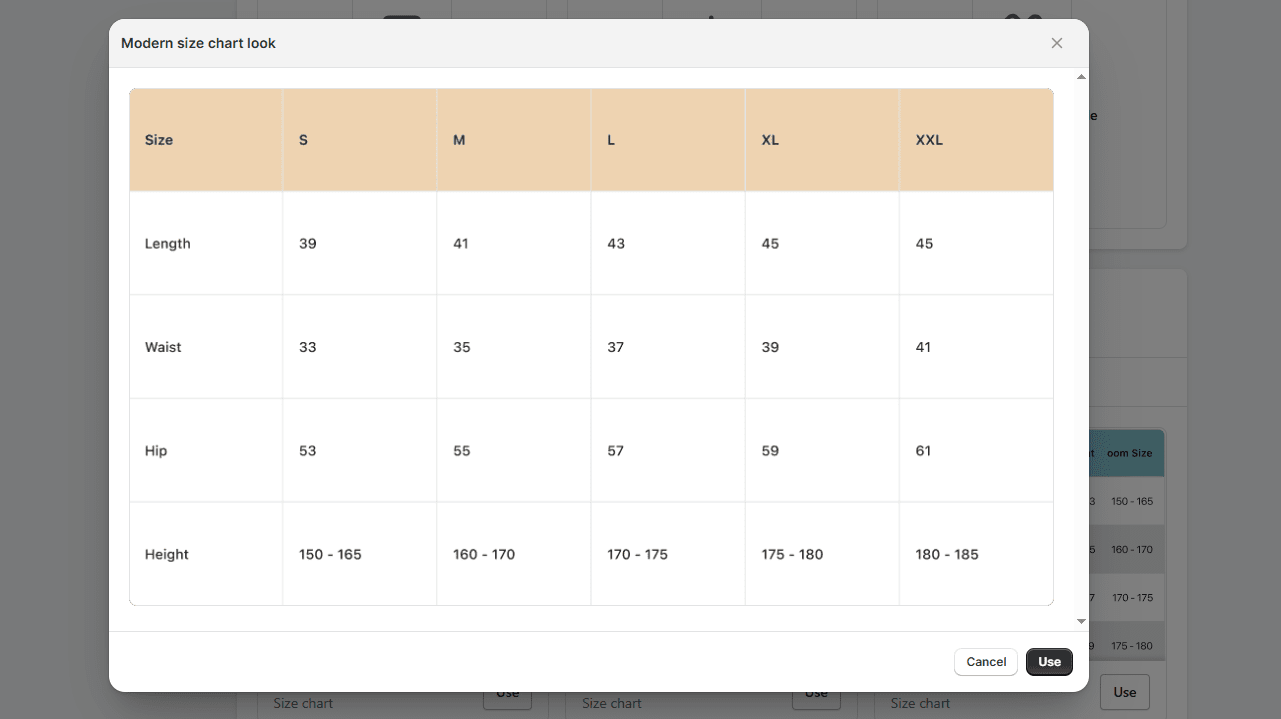
If you are in the clothing and footwear business, an online size chart is an important table to add to your store. It provides details regarding measurements to help customers select the product based on their size.
Shopify table builder app is a great way to add a size chart to your store. You can add three looks for the size chart using the application:
1. Modern size chart
2. Universal size chart
3. Regular size chart guide
A size chart created on TablePress
Data Table
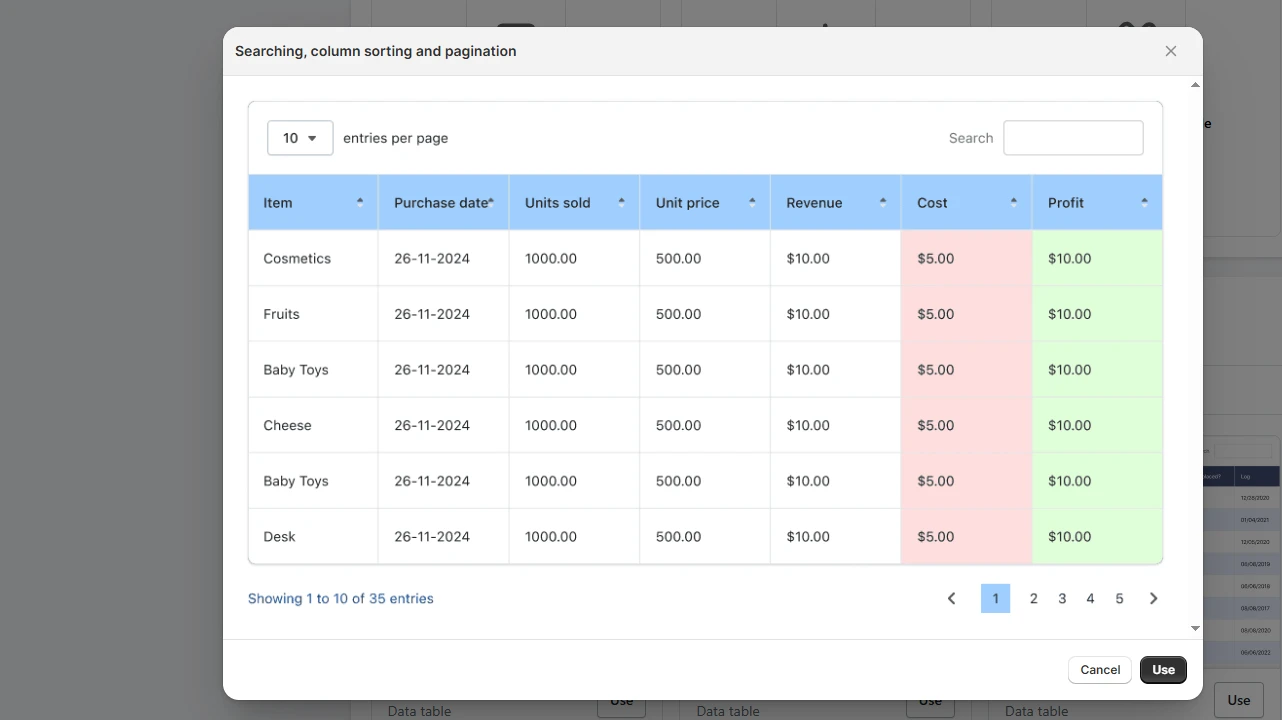
Unlike product description tables, data tables have information in both rows and columns. Data tables are used by merchants to view and analyze data efficiently.
For example, let’s say you want to know the purchase dates and the number of units sold for different items. Using Shopify apps such as TablePress helps you create these data tables so that you can interact with data and make business decisions accordingly.
A data table created on TablePress
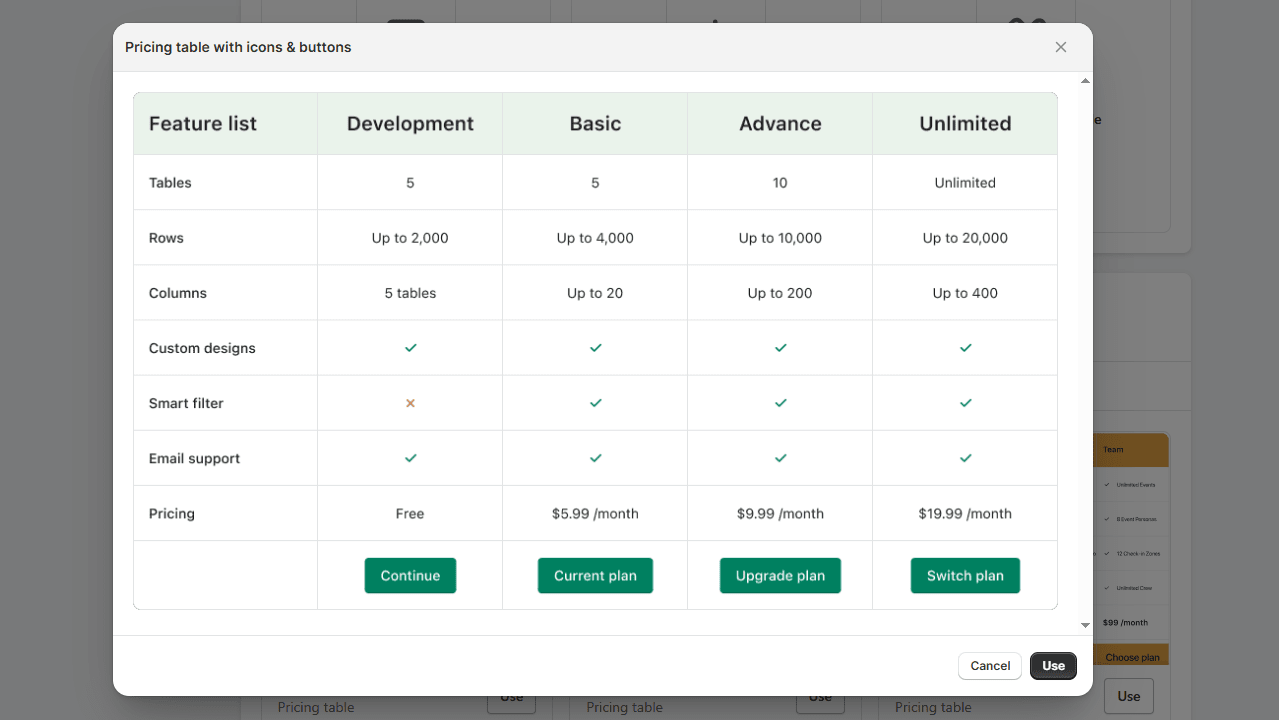
Pricing Chart
These types of charts are commonly used by service-related companies that offer multiple tiered services with different pricing options. Each row will have a benefit related to that pricing plan.
For example, if you are running any web development services, a pricing chart is useful for adding different rows of features compared to their plan.
Product comparison charts can be added to your online store in several ways. Let’s look at one of these steps in detail below.
How to Add a Product Comparison Table to My Store?
Depending on the CMS you are using, there are different ways to add product comparison tables to your store. All popular CMS platforms, such as Shopify and WordPress, provide custom HTML/CSS, plugins, and applications to add side-by-side product comparisons.
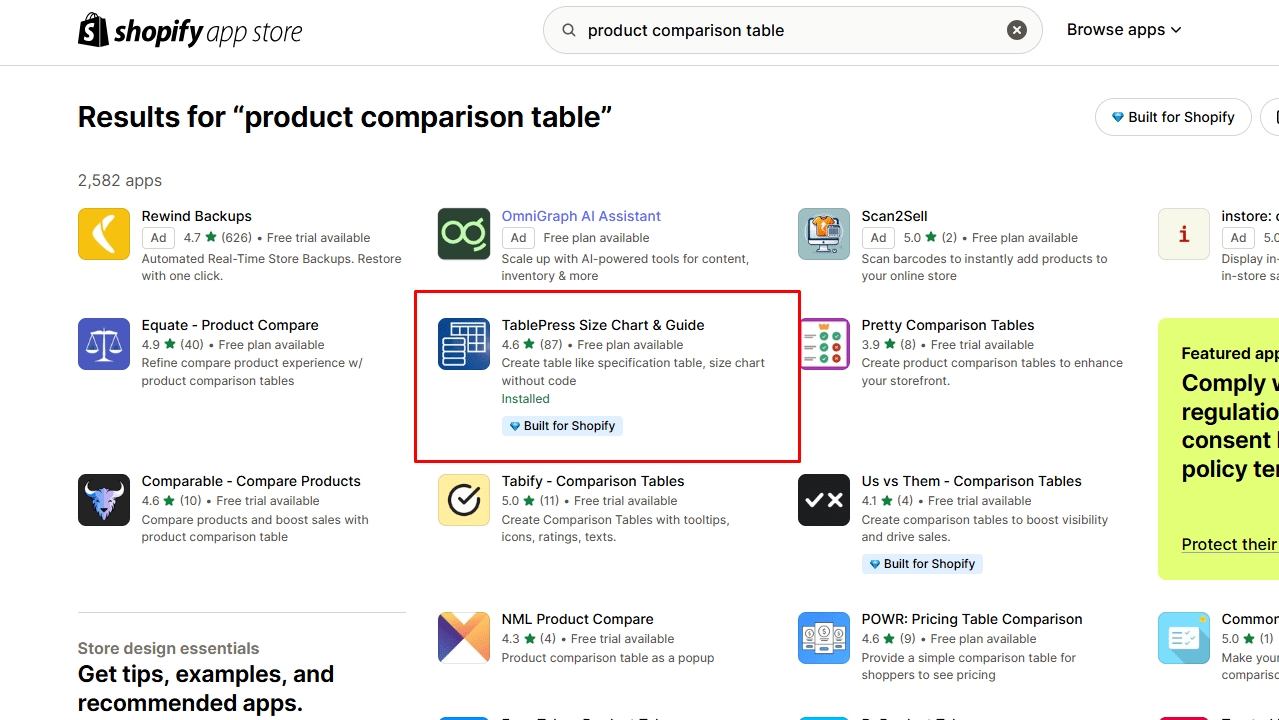
If you are using Shopify, the best way is to use Shopify applications such as TablePress. Let’s understand a step-by-step guide on how to use it.
Step 1
Go to the Shopify app store and Install TablePress.
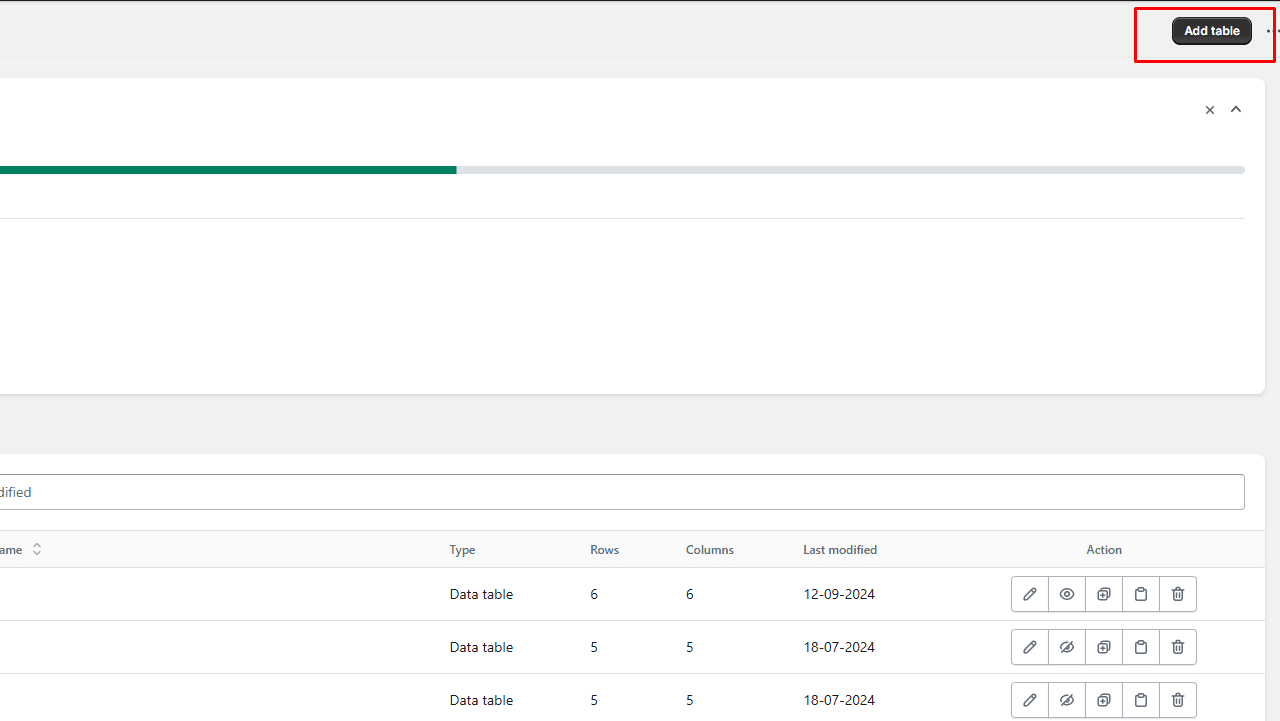
Step 2
Go to the Dashboard and click on Add table.
Note: Pricing plans vary based on the number of tables you want to create per month. The basic one starts at just $4.99 per month.
Step 3
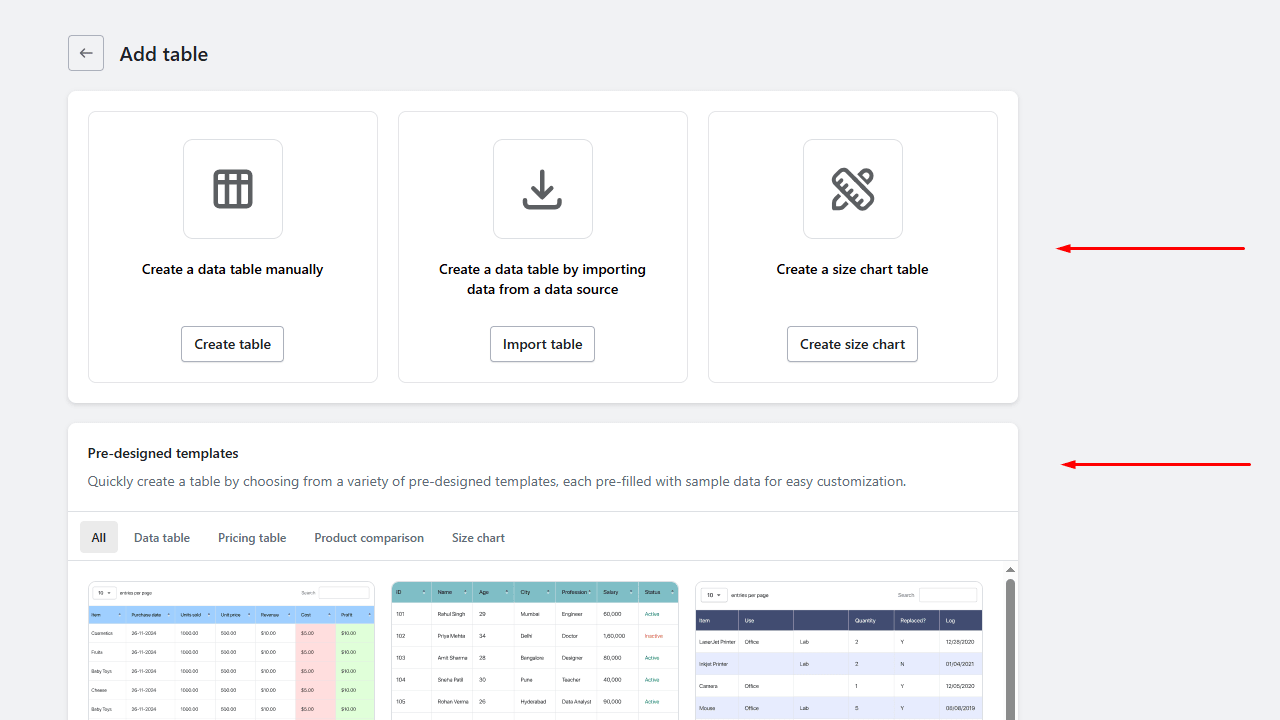
Here you have three ways to build a table.
1. Create a table manually.
2. Create a table by importing data.
3. Create a size chart table.
You will also have access to many pre-designed templates. Let’s go with one.
Step 4
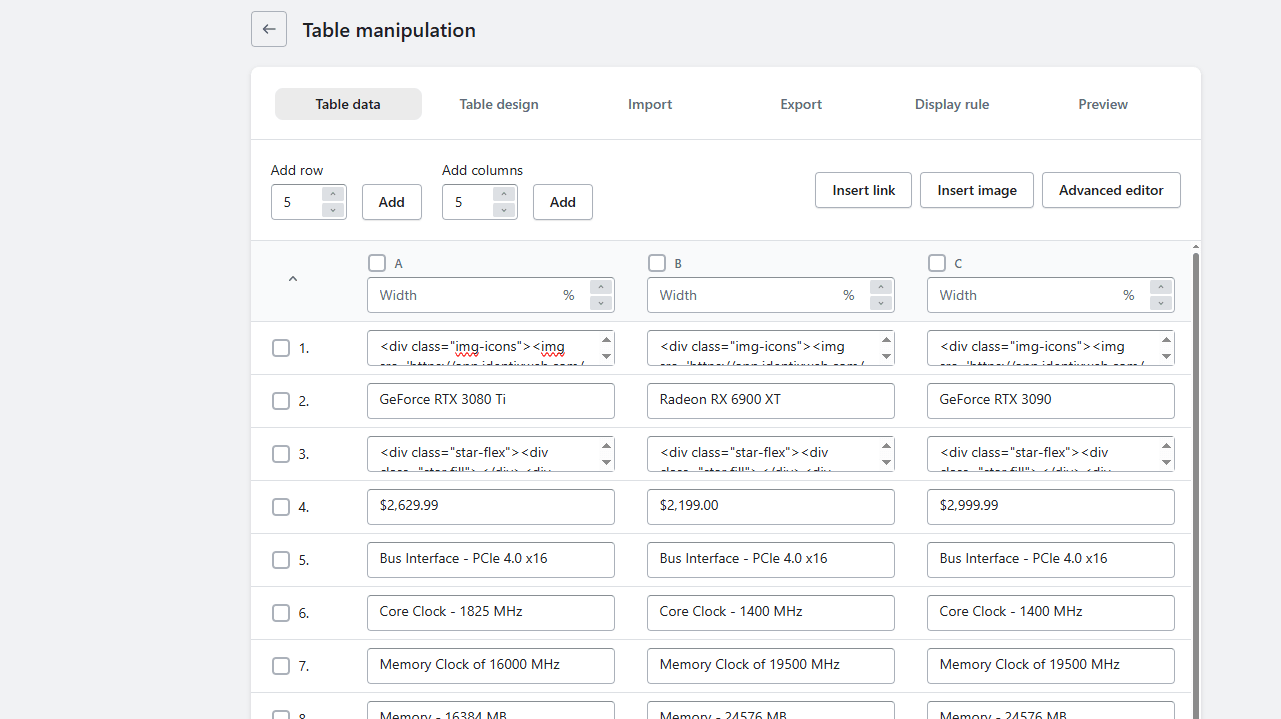
Once selected, you can easily edit the content and structure of the table. You can add text, images, or links to the chart. You can also import files to add data and swap columns and rows easily to manage your table.
Step 5
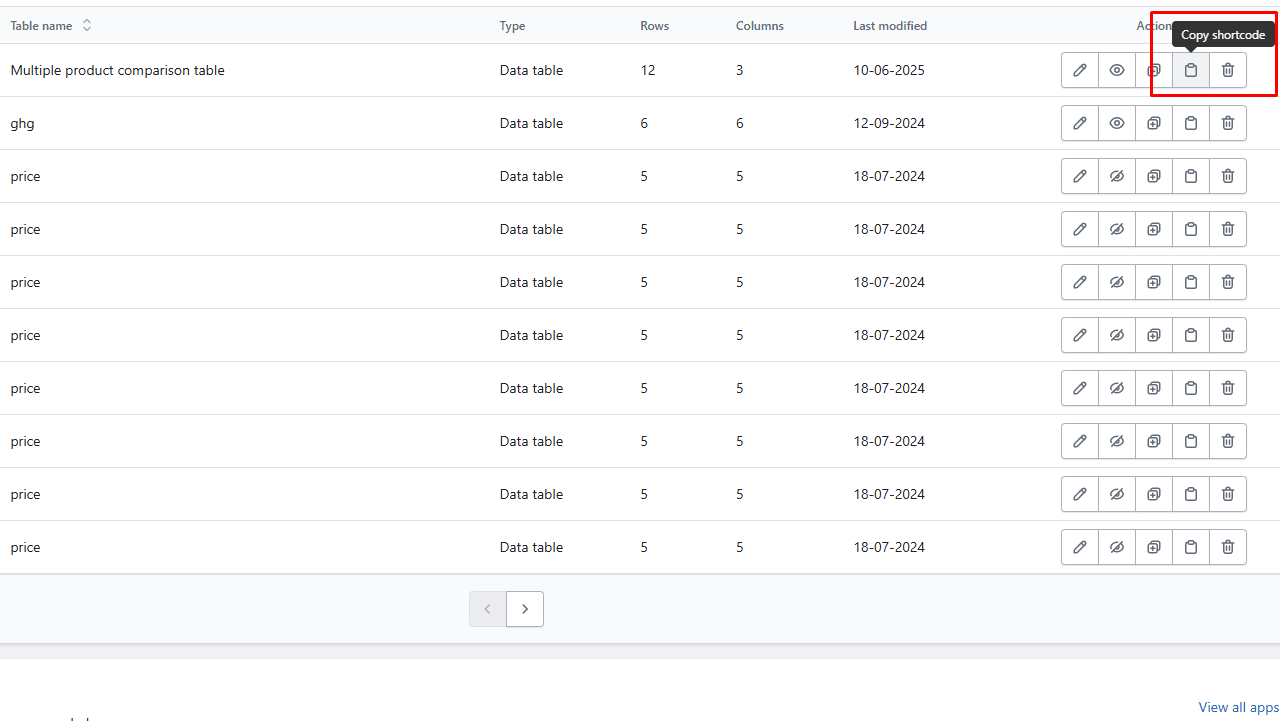
Once your table is ready, click save and navigate to the dashboard. Here you can see a section of All tables. Copy the shortcode of the table you have created.
This code allows you to embed the table anywhere you want on your website.
Step 6
Paste this code in any desired location on your website. Use the Shopify themes editor to add this code wherever you want to create the table.
This is one of the easiest ways you can add a product comparison table to your website.
Now that you have learned to add a comparison chart, let’s go through some important tips on how to create an excellent side-by-side product comparison.
4 Tips Before Adding Side-by-Side Product Comparison
Set Limited Products to Compare
According to our research, we suggest limiting the number of products to compare to five or fewer. If your brand offers different versions of the same product, add a dynamic product comparison table to let customers add or remove any feature of their choice.
Highlight Only the Important Details
This is not the product description. Keep the table concise and brief by including only the essential details. Customers want to quickly go through the info and decide which one to buy.
By highlighting only the details that are relevant, you make it easy for them to make an informed decision.
Create Visually Striking Tables
High-quality product images, brand-specific table colours, and graphics to go with text are all great for creating a visually appealing table. Your customer engagement will also increase because customers will spend more time interacting with the comparison table.
Compare the Right Information
It’s tempting to create side-by-side product comparisons for all your products. But not all your products have similar features. Only compare information that is relevant across different versions of the product.
If you add side-by-side product comparisons that are different, the customer will find the table useless and will go elsewhere.
Product Comparison Chart: A Time-Saving Tool That Generates Revenue
Information overload will scare off customers. Displaying info briefly and concisely will help the customer make a faster decision. It will also help you to increase your sales.
Side-by-side product comparison is a clean and clear way to add short and crisp information about products. Whether you want a size chart, a pricing plan table, or a simple product comparison table, this tool is easy to use, and the benefits you get from it are huge.
FAQs
1. How to compare two or more products online?
The best way to compare two or more products on your website is to add a product comparison table.
2. How do product comparison charts work?
Comparison charts are visual representations of the comparison between two or more products. When added to the online store, these tables help customers to quickly compare products, make an informed decision, and add the chosen item to the cart.
3. What should be included in the product comparison table?
The name of the product, a high-quality image, relevant features to compare, texts like “Yes” or “No” to indicate if a feature is available or not, and the price of each product are common things you should include in side-by-side comparisons.
4. How to add product comparison tables to my store?
Different content management systems provide various ways to add comparison charts to the store. You can use custom CSS/HTML, plugins or applications to add comparison tables to your online store.
5. What are some of the best Shopify applications to create product comparison tables?
TablePress, Tabify, and Tabs Plus are some of the best Shopify applications to add a product comparison table to your Shopify store.




![District Shopify Theme Review: Pros, Cons, & Features [2026] District Shopify Theme Review: Pros, Cons, & Features [2026]](https://www.identixweb.com/wp-content/uploads/2025/12/25-12-Thu-Blog-District-Shopify-Theme-Review-Pros-Cons-Rating.webp)


About the author
Vineet Nair
Vineet is an experienced content strategist with expertise in the ecommerce domain and a keen interest in Shopify. He aims to help Shopify merchants thrive in this competitive environment with technical solutions and thoughtfully structured content.