SellMore’s Analytics feature gives you a detailed view of how your post-purchase upsell campaigns are performing across your Shopify store. From overall revenue to widget-level results, you can track your success and make informed decisions to improve your sales strategy. This guide explains each part of the Analytics dashboard so you can track your revenue, conversions, and the effectiveness of your offers.
In this guide, you’ll learn:
- How to read each section of your Analytics dashboard
- What the metrics mean
- Tips to interpret the data effectively
Overview
The Analytics dashboard shows you:
- Revenue generated by the app over time
- Accepted offers by your customers
- Conversion rate, Average Order Value (AOV), and Return on Investment (ROI)
- A page-wise breakdown of how each upsell, recommendation, and bundle widget is performing
At the top right, you’ll see a date filter. You can easily adjust it to view results for a specific day, week, or month. This helps you track trends and compare periods.
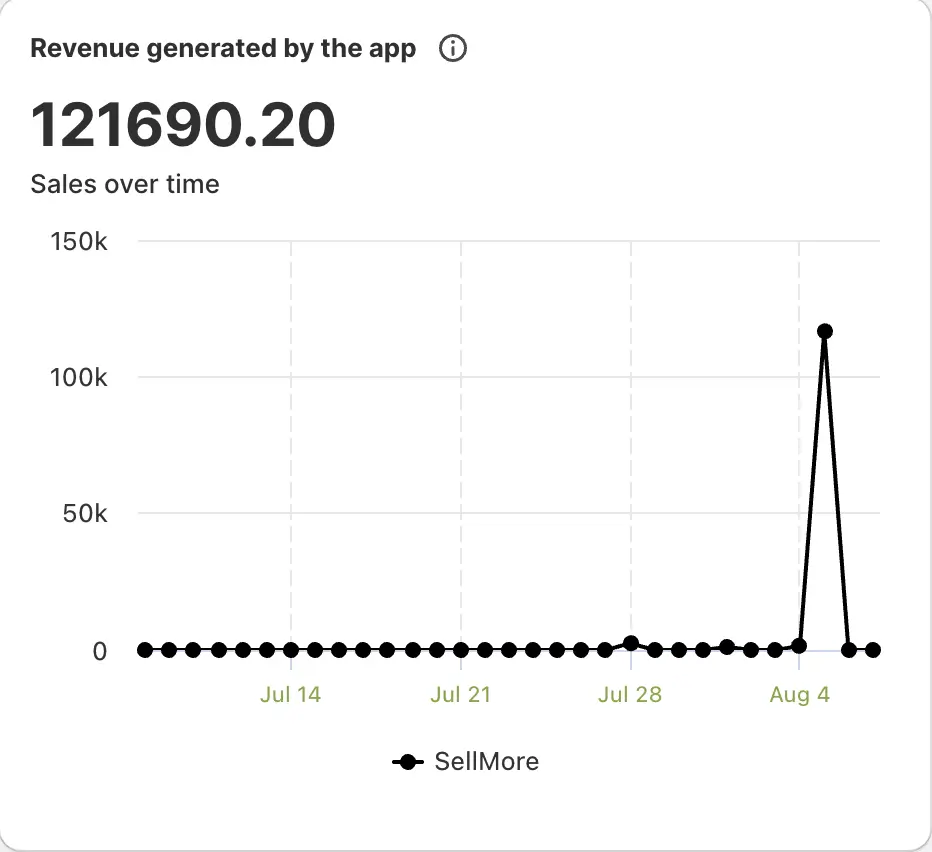
Revenue generated by the app
This section shows the total revenue generated through the app over time. Use this graph to monitor sales trends and evaluate whether your offers are boosting your revenue.
Offer accepted
This area displays how often customers interact with your offers:
- Total Clicks: How many times offers were clicked.
- Offer Accepted: How many times offers were accepted (added to an order).
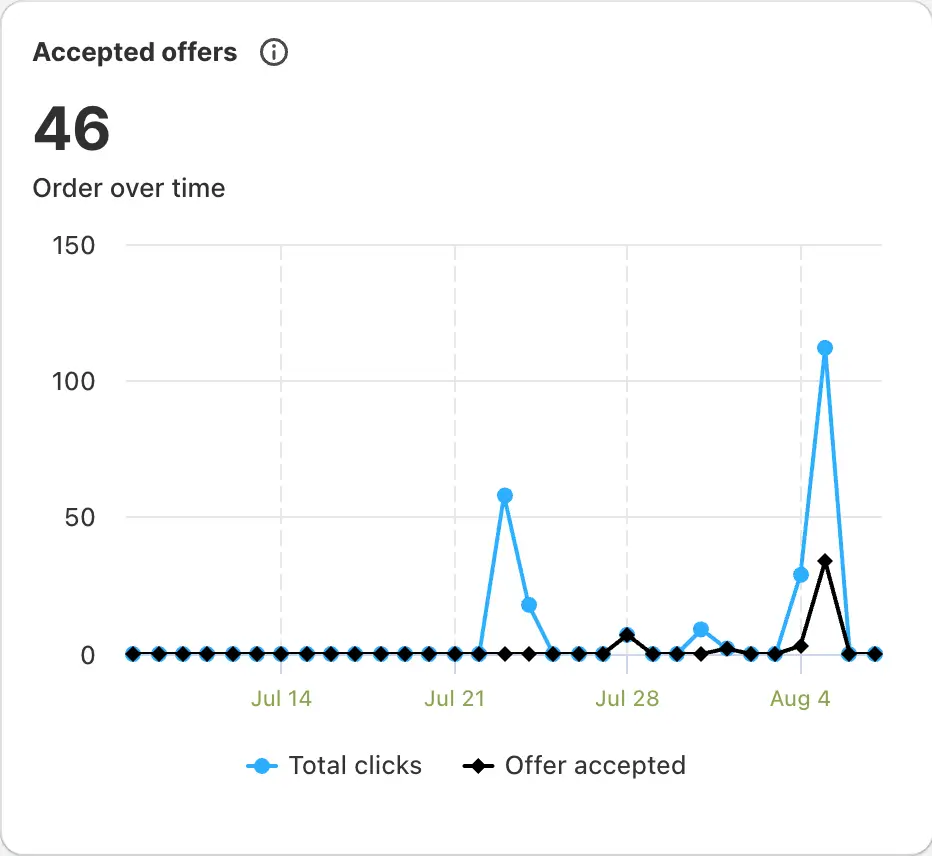
This helps you understand both engagement and actual conversions.
Funnel Metrics
Here you’ll see three essential metrics:
- Conversion Rate (%): The percentage of clicks that turned into accepted offers.
- Average Order Value (AOV): The average value of orders containing upsell offers.
- ROI: The return on investment you’re getting from using SellMore.
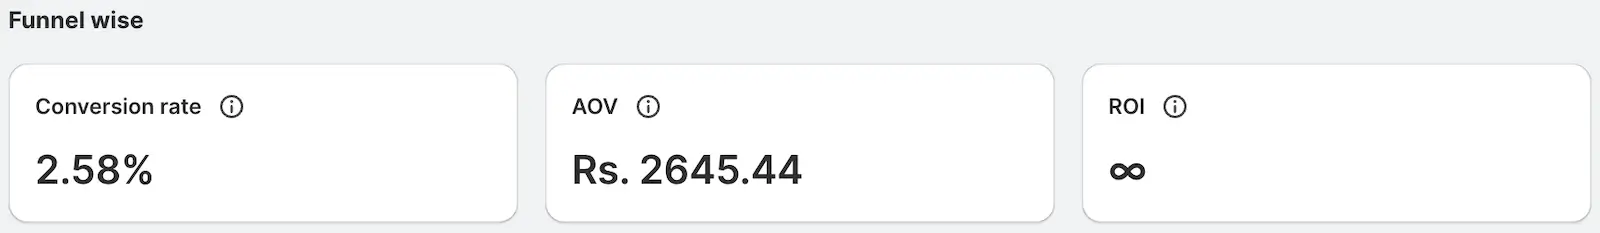
These numbers help you assess whether the app is delivering profitable results compared to your investment.
Page-wise analytics
Page-wise analytics help you see exactly which pages and widgets are driving revenue.
Pages Tracked:
- Checkout Page
- Post Purchase Page 1
- Post Purchase Page 2
- Post Purchase Page 3
- Thank You Page
- Order Status Page
Widgets Tracked:
- Bundle
- Recommendation
- Upsell
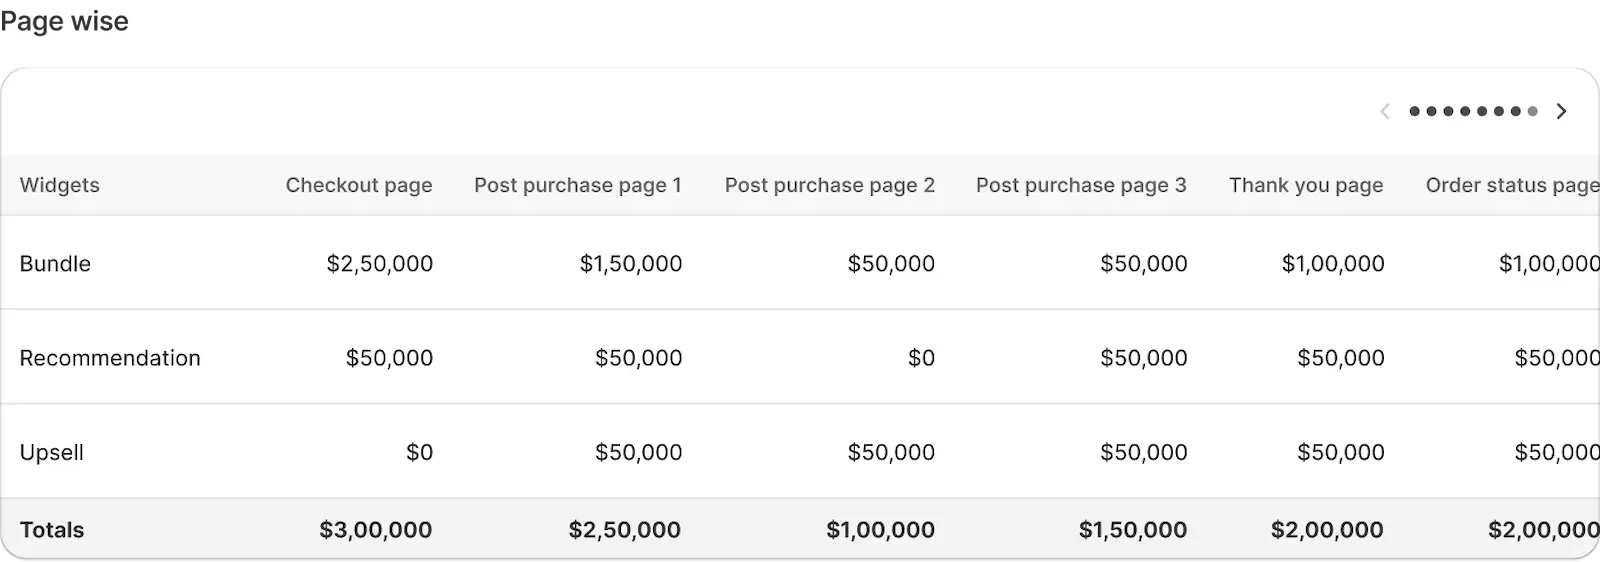
For each widget, you’ll see the revenue generated on each page. At the bottom, you’ll find a total row summarizing revenue across all widgets and pages.
Use this data to:
- Compare which pages and widget types drive the most sales.
- Identify underperforming offers.
- Optimize widgets to improve conversions.
- Optimize offers where engagement is low.
- Focus on high-performing pages to maximize revenue
Regularly review this data to fine-tune your strategy and grow your sales with evidence-based decisions.
Summary
The Analytics dashboard empowers you to see exactly how SellMore drives additional revenue for your store. Use these insights to fine-tune your upsells, experiment with new ideas, and grow your profits.
Need help?
If you’d like help interpreting your analytics or improving your upsell results, feel free to email us or live chat with our support team — we’re always here to assist you!