When you are running an online store, it’s important to know how your store is performing. Reports are a key part of understanding your store’s performance, and ecommerce metrics play a huge role in reports.
- How many customers are coming to our store through mobile devices?
- How many of them are abandoning their shopping carts?
- How many customers are returning their products?
All these questions need to be quantified. This is where ecommerce metrics and KPIs solve your issues. But what’s the difference between the two? Let’s understand them to figure it out.
What are Ecommerce Metrics?
An ecommerce metric is a measurement that tracks any aspect of ecommerce performance. For example, ‘Customer Abandonment Rate’. This metric tells you how many customers are abandoning their shopping carts in your store.
What are Ecommerce Key Performance Indicators?
Key performance indicators, or ecommerce KPIs, are any measurement that is tied to the business goal. For example, ‘Customer Abandonment Rate Decreased by 25%’. This is called a KPI because it’s tied to a specific target of your ecommerce business.
In short, a metric is the measure of a process, while a KPI is the measure of how the process is performing at any specific time.
Now, let’s understand 14 key metrics for ecommerce to gauge the performance of your online store.
14 Important Ecommerce Metrics to Track in 2026
Average Order Value (AOV)
This is the average price of items that customers are adding to their cart and proceeding to check out. The higher the AOV, the better your store is performing.
You can increase your AOV by adding product bundles and relevant product recommendations. Both of these are great upselling and cross-selling strategies to increase your sales.
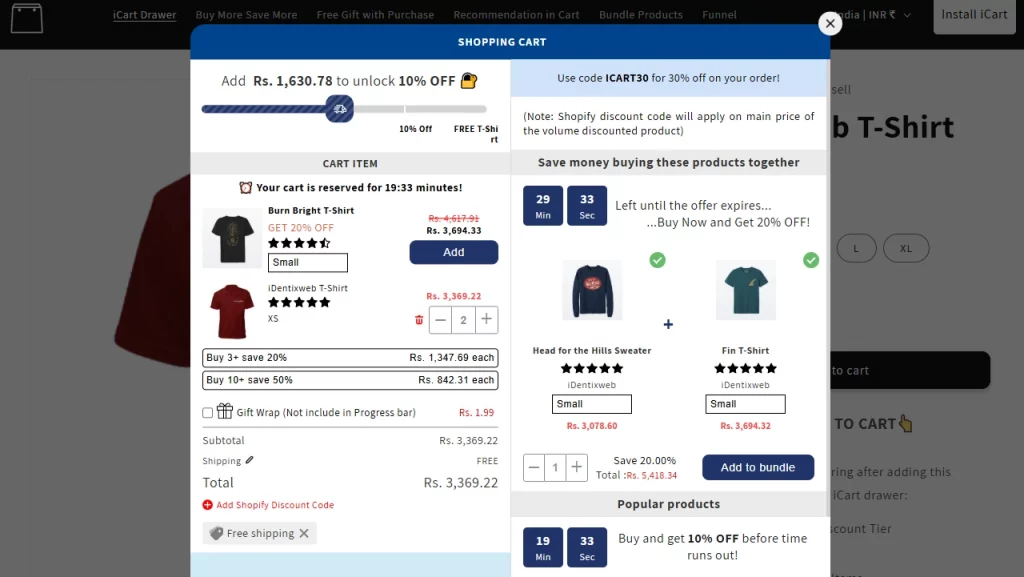
Shopify apps like iCart help to create product bundles to increase your AOV
Cost Per Acquisition (CPA)
This value indicates the cost associated with acquiring a new customer. These will be first-time customers you acquire through email marketing, paid ads, or even offline marketing.
The lower the CPA, the more effective your marketing and sales campaigns are. But if your marketing budget is exceeding your CPA, it’s time to rethink your strategy.
Cart Abandonment Rate
If you are running an online store, there will be customers who won’t complete their checkout. This is called shopping cart abandonment. Naturally, the higher this rate is, the more losses your business will suffer.
Cart abandonment rates can be reduced by simplifying the checkout process. Adding a progress bar to the shopping cart is another great idea. With discounts added to the progress bars, you can encourage customers to check out faster to get the reward.
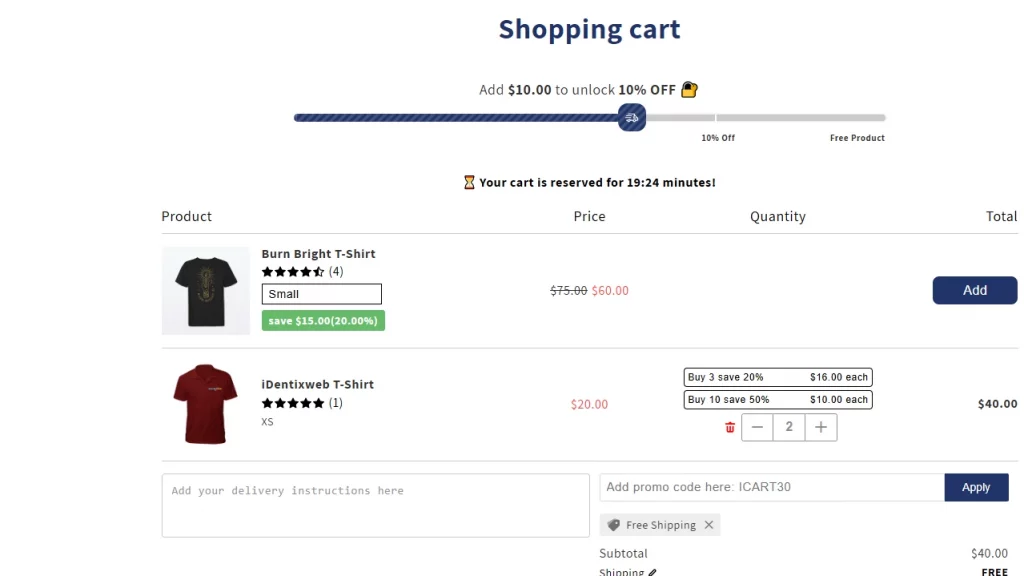
Shopify apps like iCart help to add progress bars to decrease your cart abandonment rate
Conversion Rate
By far the most important metric for any business is sales conversion rates. This rate is the total number of purchases made out of the number of users who visited your store.
It’s a given that the higher the conversion rate, the better your store is performing. In order to increase conversions, make sure to simplify the customer shopping experience. In simple terms, ensure your site speed is good, navigation is intuitive, visuals are high quality, and you provide discounts and offers to your customers.
Refund Rate
This is a metric of how many customers refund or return an item. If the refund rate of your store is high, it means your product or service is of poor quality and not meeting the customer's requirements.
There may be many reasons for a high refund rate. Mismatches in product descriptions, quality of the product, or problems with delivery. Create a customer service channel to determine the cause of their dissatisfaction with your product. This will help you pinpoint the exact cause.
Customer Lifetime Value (CLV)
This value is the total revenue generated by a customer over a specified period. Ecommerce loyalty programs are an important part of customer lifetime value.
Say you run an online t-shirt business. If the average number of customers who buy $10 t-shirts is 20 over a period of 10 years, your CLV is 10 × 20 × 10 = $2000.
This metric takes time to calculate. So, focus on customer loyalty programs to achieve long-term business success.
Repeat Customer Rate
This rate is the number of customers who made more than one purchase from your store. Again, a good customer loyalty program is a factor in increasing the repeat customer rate.
If customers are not returning for purchases, focus on retargeting ads. These ads are great to target customers who have made purchases from your store. If your repeat customers are still low, take a look at your customer experience and see if you can upgrade it.
Impressions
This metric means how many times a piece of content, such as ads, a blog post, or a landing page, is seen by a customer. It doesn’t matter if the customer has engaged with it or not. If the content gets to their screen, it's an impression.
For example, if you post something on social media and get 3000 impressions, it appears 3000 times on the user’s screens. You cannot see how many people have clicked on it or engaged with it in some other way.
A higher impression is important for brand awareness and visibility.
Reach
While impressions can have the same user viewing your content multiple times, reach is a metric for unique visitors. For example, if you upload a social media post and your reach is 3400, that means you have 3400 unique visitors to see your post.
Even if one of 3400 users saw your post multiple times, the reach will still count as 1 for a single user. If your reach is high, it means your brand is reaching out to a diverse audience.
Engagement
This is the combination of your reach and impressions. Engagement is the number of users who have engaged with your content in one way or another. It may include likes, shares, comments, or session duration.
For example, let’s say you announced the launch of your shoe store through a social media post. It got 500 likes, 200 shares, 100 comments and 700 clicks on the post. All these count as engagement. The higher you keep your engagement, the stronger your connection to your audience.
Churn Rate
This metric is the percentage of customers who stop using your service in a specific time period. For example, let’s say you have a monthly newsletter with 5000 subscribers. After a year, it came down to 3500 subscribers. So, the churn rate here is 30%.
Churn rates differ based on industries. No matter the industry, figure out why your customers are leaving and how you can improve your products or services.
Net Promoter Score
This score is based on the number of customers who are likely to recommend your business to their friends and family. A great way to calculate the net promoter score is to have a survey at the checkout page. ‘From 1-0, how likely are you to recommend us to your friends, family or colleagues?'
Based on this survey, you can sort your promoters, detractors and passives.
Promoters
People who select 9-10
Passives
People who select 7-8
Detractors
People who select 1-6
NPS = Promoters - Detractors
Let’s say 10 people were surveyed, 60% of them were promoters, 20% were passives and 20% were detractors. So your NPS score is 60 - 20 = 40%.
NPS depends on everything from product quality to customer service. So, make sure to keep a great shopping experience for a high NPS score.
Store Sessions by Device Type
With the rise of mobile-first ecommerce, this metric has gained significant importance. This is a metric that shows the number of people accessing your store through desktops, tablets, or smartphones.
For example, if you see more than 50% of your customers coming through smartphones, it's time to focus on mobile optimization and responsiveness.
Click Through Rate (CTR)
This is a common metric used across ecommerce stores. CTR is the rate at which a user clicks on your content. This can be anything from a social media post to an email.
For example, let’s say you ran an email campaign for 10,000 recipients. 200 recipients opened your email, and 100 of them clicked on a link. So the open rate here is 2%, and the CTR here is 1%.
CTR is an easy metric to gauge the success of your sales and marketing campaigns. To increase your CTR, focus on leveraging the right keywords and visuals.
Ecommerce Performance Metrics: Why Should You Look into Them?
You need to have a clear understanding of how your store is performing. Ecommerce KPIs & metrics help to pinpoint the areas that need to be focused on.
Start by measuring the metrics related to your business goal daily. If your goal is to increase visibility, focus on reach, impressions and engagement. If your goal is to increase revenue, focus on the cart abandonment rate and the conversion rate.
First, keep an eye on your ecommerce metrics daily. Slowly build from there to measuring weekly and monthly. Always set a KPI target like ‘Increase reach by 45%’ or ‘Decrease cart abandonment rate by 25%”
The ecommerce metrics mentioned in this article will help you identify how key processes in your store are performing. Fine-tune the challenges in these areas to reach your goals in 2026.
FAQs
1. How frequently should I review my ecommerce metrics?
It depends on your ecommerce KPIs. It can be weekly, bi-weekly, monthly, quarterly, or yearly. The time period to check your ecommerce metrics based on business goals.
2. What are the key metrics for ecommerce?
Average order value, cart abandonment rate, refund rate, and conversion rate are some of the best ecommerce metrics to track.
3. What tools should I use to measure ecommerce metrics?
Shopify Analytics, WooCommerce Analytics, and Google Analytics are the top 3 ecommerce analytics tools to measure ecommerce metrics.
4. Are metrics and ecommerce KPIs the same?
No. Metrics are a measure of any process, like average order value. Now, if the average order value target is $70 in 1 month, it's a key performance indicator. KPI, in simple terms, is the measure of the performance of any process in a given time.
5. How to measure ecommerce success?
To measure ecommerce success, track key metrics daily. Set a business goal like ‘30% increase in AOV in 1 month’. Check key metrics associated with your goal daily to see if it's performing well. If not, implement changes and track the progress of the metric over time.




About the author
Vineet Nair
Vineet is an experienced content strategist with expertise in the ecommerce domain and a keen interest in Shopify. He aims to help Shopify merchants thrive in this competitive environment with technical solutions and thoughtfully structured content.