


Whether it is our life or business we are expecting more out of it. In order to gain more, we need accurate feedback. Shopify analytics does the same when it comes to eCommerce business. By analyzing Shopify analytics data you can know how well your online business is performing.
In this blog, you will understand the importance of each Shopify analytics metric and how to use it for the benefit of your business. Without any further ado, let’s get started.
Reasons To Study Shopify Analytics Data
Following are the reasons why you should study Shopify analytics data:
- Know your best-selling products
- Helps you optimize advertising expenditure
- Data-backed decision making
- Helps increase profit margin
- A better understanding of online shoppers’ behavior
- Data-driven business planning
- Helps in procurement
Understanding Shopify Analytics Reports
Following are the Shopify store analytics reports that you should study for your online business:
Live View
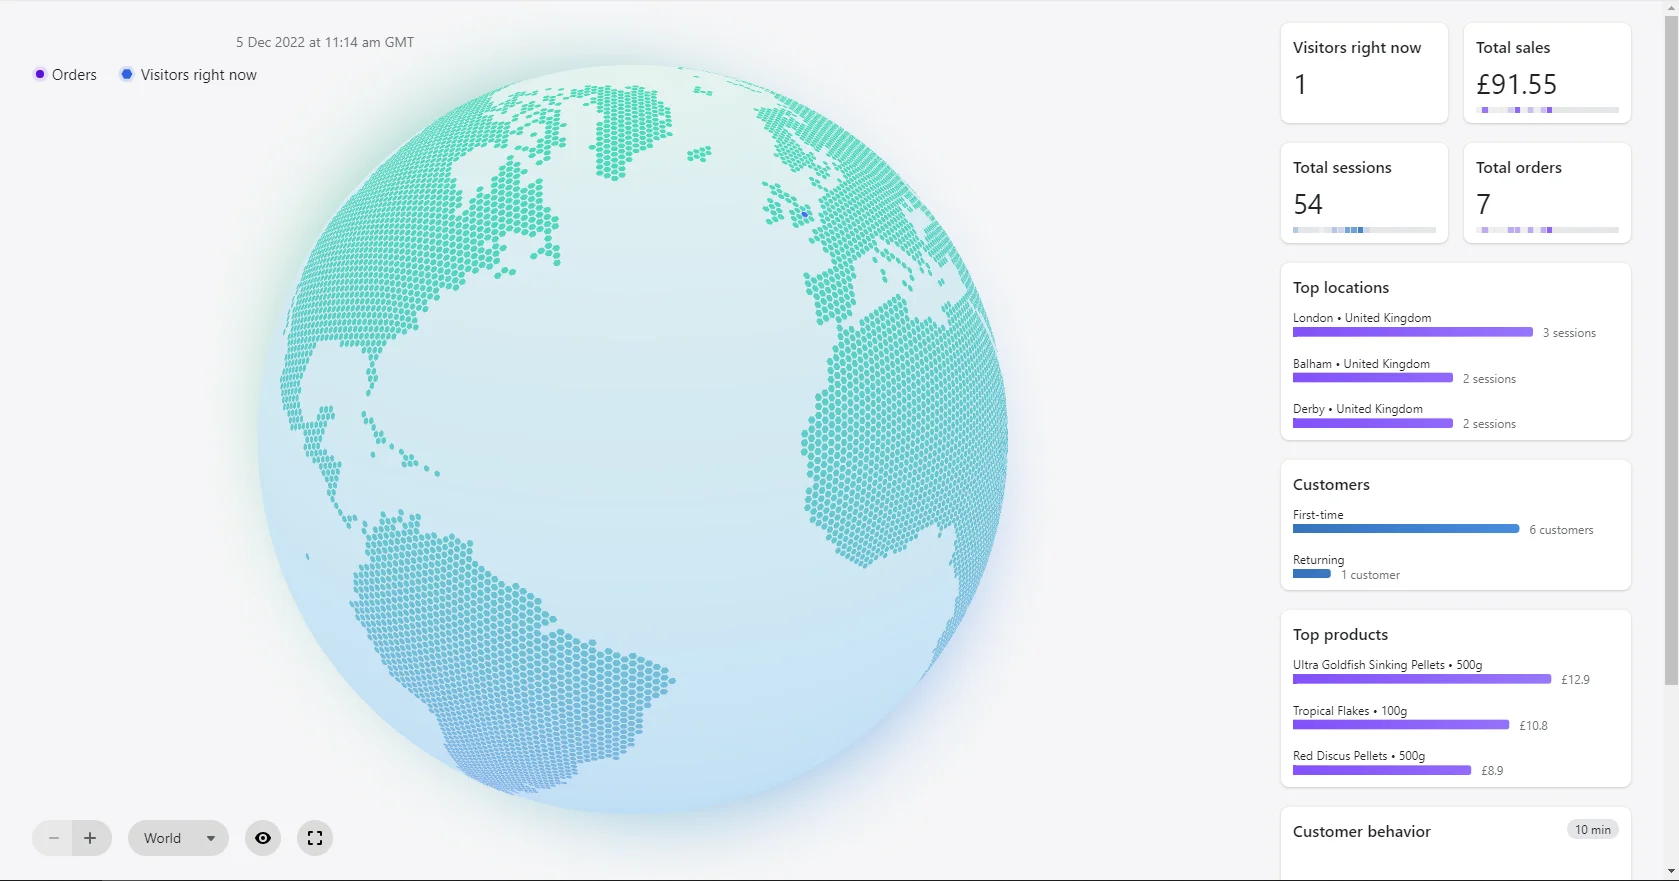
Yes, you guessed it right. Live view provides you insights into activities being done (on your store) in real-time.
You will be able to see a globe and a world map with which you can know from which part of the world customers are located and doing activities on your online store.
Most Important Metrics Of Live View
Live visitors - Number of active users browsing your website in the past 5 minutes.
Total sales - It includes purchases from your e-commerce website since midnight. Formula for total sales: (Total sales = Gross sales − Discounts − Returns + Shipping + Taxes)
Total sessions - Number of sessions by all the users since midnight.
Top location - Location from where maximum shoppers are coming to your store.
First-time customers - Customers who have placed an order in your store for the first time.
Top products - Products with the highest selling, in terms of percentage since midnight
Active carts - One or more products added to the cart within the last 10 minutes
Checking out - Sessions of existing customers proceeded to check out.
Order completion - Sessions of customers where payment is made successfully
*Quick tip* - If you want to know the number of failed transactions, subtract ‘checking carts’ from ‘order completion’.
Ways To Leverage Live View Data
In the following ways, you can make use of ‘live view’ data:
Identifying highest selling product/s - With live view reports you can identify which products are selling more than the others. This data point can be used to decide on which product you should promote more to bring more sales.
Knowing customers demography - Using ‘top location’ data one can decide the target market for marketing content strategy.
Optimization requirements - When you know what made customers leave your e-commerce, you can identify exactly where website optimization is required.
Analytics
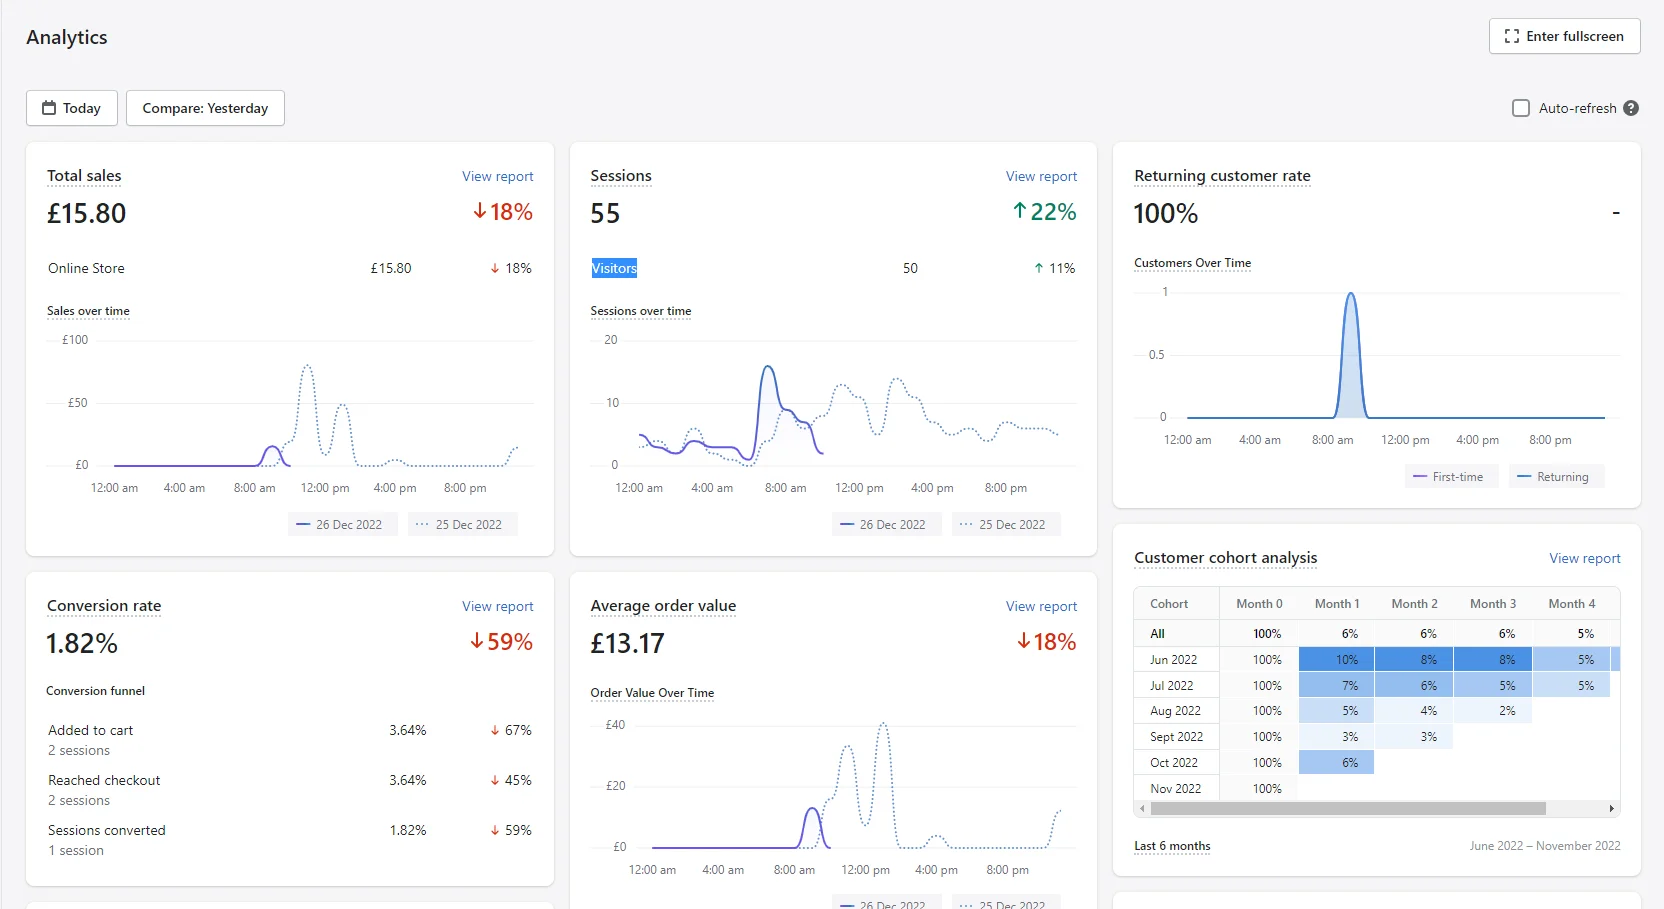
In the analytics module, you will get valuable insights and user behavior coming to your website. As opposed to live view, the data is not provided in real-time but you can check the same for a particular time frame, for example, last week, last month, or last year.
List Of Essential Metric from the Analytics Module
Following is the list of important metrics available in the analytics module:
Average order value - It is calculated by dividing the total value of products sold (till date) by the total number of orders received. It includes shipping costs and taxes.
Online Store Sessions by device type - It is the number of sessions of your Shopify store with the information of the type of device used to access your online store.
Online Store Sessions by location - It is the number of sessions of users coming from different countries.
Conversion rate - It is the percentage of sessions that resulted in placing an order successfully.
Online Store Sessions by traffic source - Sessions are classified based on the source they are coming from, i.e search engine, social media platforms, email, or direct.
Repeat customers rate - It is the percentage of customers who placed an order at least two times.
To go beyond basic Shopify analytics and extract deeper insights, you can import Shopify data into BigQuery and leverage its powerful querying and ML capabilities.
Analytics Data Usage
In the following ways, you can utilize analytics data
Improve customer retention - With the data available to you in analytics, you can craft a strategy to retain customers.
Reduce bounce rates - Improve customer experience (CX) by making use of the data that make customers stay on the online store.
Price optimization - Once you know the target market, you can re-set the pricing of your product considering the purchasing power of people belonging to the particular demographic location.
Reports
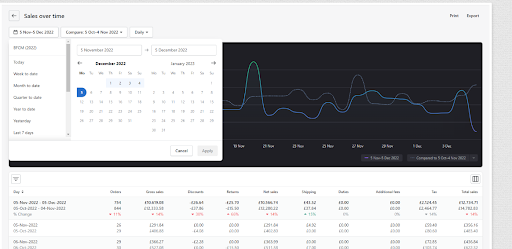
In case you want to know the performance of your store in detail then you should start checking reports generated by Shopify Analytics. The best thing about these reports is that they are intelligently segmented from the perspective of the customer journey as well as the business journey. Here are the details on the types of retail sales reports generated by Shopify analytics:
Acquisition Reports
In this report, data on visitors and sessions are stored over the course of time. One thing you must know is that it does not include sales and the total number of orders received.
Total sessions - It denotes the total number of sessions in a given time period
Sessions by source - It refers to the total number of visitors coming from different sources i.e email, social media, direct or search engine
Sessions by location - Represents the number of visitors coming from different locations
Usage Of Acquisition Reports
- To find top traffic sources
- To find a target market and to flag-off localized campaign
Behavior Report
In behavior reports, you get data on how visitors interact with your brand (Shopify store). With this data, you get insights into what they are looking for, their expectations, where they got stuck during the buying journey, and sessions converted. The following are the important metrics of behavior report:
Conversion over time - It denotes the percentage of sessions where an order is placed. Online store conversion rate, add-to-cart rate, and checkouts initiated, are the metrics included in it.
Online store speed - It is the speed at which your store is loaded. It increases when visitors are fewer and vice versa. If this parameter deteriorates, all the metrics plummet.
Product recommendation conversion - This metric will be shown only when you use product recommendation features. It includes clicks (on recommended products), adds to the cart, and a successful purchase.
*Quick tip*: If your product recommendation strategy/app is not delivering satisfactory results then you must install iCart. It is a Shopify app that intelligently recommends products and will boost AOV.
Top searches - It provides you with a list of top online store searches (keywords) that were highly searched on your store.
Top searches with no results - A list of keywords that showed no results (when searched on your online store). It gives you an idea about the gap between your customers’ requirements and your offerings.
Sessions by landing page - It informs where customers landed first on your e-commerce site
Sessions by device - What device your customers are using to access/interact with your e-commerce store
Online store cart analysis - This helps you understand customers’ behavior by showing the products they added to the cart within the last 30 days.
Meaningful Usage Of Behavior Report
- To write detailed product descriptions
- Optimize the landing page for the better buying experience
- Plan advertising campaigns based on the preference of target customers
- To improve cross-sell and up-sell strategies
- To deliver a top-notch buying experience on all the devices
Customer Reports
This report contains customer behavioral data with your brand. Under this report, you will gain insights into average order totals, average order counts, and expected purchase value. The following is the list of different data you will under this report:
Loyal customers - It shows the number of customers who make frequent purchases
Customers over time - Number of customers who made at least one purchase from your eCommerce store
1st-time customers vs returning customers sales - It is a breakdown of value generated from first-time customers and returning customers
At-risk customers - Customers who have made a purchase at least once but no order is placed within the last 30 days
Ways To Leverage Customer Report
- Shot marketing emails to at-risk customers and re-engage with them
- Assists in making customer segments
- Identify loyal customers and reward them with special discount offers
- Draft a strategy to convert one-time customers into loyal customers
- Get to know average customer lifetime value
*Note* - Customer report is limited to the data of 250,000 customers only. If you want to study the data of more customers you need to install Google Analytics.
Finance Reports
This report contains debit and credit entries such as Shopify fees, sales data, and refunds. The following is the list of other important data points of finance reports:
Sales – All the data on gross sales, discounts, net sales, returns, shipping, and taxes
Payments - Payment method used by the most customers
Liabilities - All the figures relating to gift card, sales and tips received
Total sales - The formula to calculate total sales is (Gross sales - discounts - returns + taxes + shipping)
Financial summary - Represents the summary of sales, payments, liabilities, and other financial data for the given time period
Financial Data Report Uses
- Manage finances efficiently
- Make data-backed financial decisions
- Cut-down unnecessary expenses
- Monitor profit margins
- Product price optimization
- Manage taxes as per government regulations
Inventory Reports
It tells the end-of-month status of inventory and also provides data on the percentage and quantity of inventory sold per day. With the use of this data, you can forecast demand and plan procurement accordingly. Here is the list of important metrics to track:
ABC Analysis - Makes you aware of the products that give you 85%, 15%, and 5% of the revenue
Average inventory sold per day - It represents the number of items sold in a day on a product basis.
Month-end snapshot - It tells you the quantity of each product available in stock at the end of the month
Inventory remaining days - Get the estimate of how long the inventory will last (in number of days).
Application Of Inventory Report
- Track the hot-favorite product of customers
- Plan your procurement
- Identify high-profit margin products
- Demand projection
Marketing Reports
With marketing reports, you will know what channel/campaign is bringing the most customers to your Shopify store. This report will make it easy to track the effectiveness of marketing campaigns. The following is the list of metrics you will study in this report:
Sales attributed to marketing - It refers to the sales concerned with trackable marketing efforts
Referrers - Contribution of different sales channels in driving traffic to your store
Interaction - Know what was the first point of contact (referrers) of the customer with your brand
Leverage Marketing Report Data
- Know what are your top referrers
- Know your best marketing channel
- Attribute AOV to each referrer
Order Reports
Order report provides insight into order fulfillment, the volume of orders, and much more. The following are the important metrics of the same:
Order quantity - The total number of orders received during a given time period
Returned quantity - The total number of orders returned during a given time period
Return rate - Number of orders returned compared to the total number of orders received
Average units ordered - The average number of units (product) bought per order for a selected time period
Average order value - The average value of orders for the selected time period. It is expressed in currency i.e. dollar, rupee, pound, or euro, depending on the home country you selected.
Usage Of Order Reports
- Know how many orders are returning
- Know the number of products being sold per order
Profit Reports
In profit reports, you will get to know how much money you are making from the Shopify store. The following is the list of metrics you will find under profit reports:
Net sales - The total net sales for the given time period
Gross margin - It is calculated as [(net sales - cost)/(net sales)]*100.
Gross profit - The total profit made on the selected product during the selected time period.
Application Of Profit Reports
- Know how much money you are earning
- Gives you insight into the gross margin
Product Analytics
Product analytics report provides insight into the products which are selling fast and also the products which are struggling to get a single order. Let’s understand different metrics under product analytics:
Net sales by channel - Sales channel which generated maximum revenue
Net units sold by traffic channel - Number of products sold by customers coming from different traffic sources
Customers - Number of new customers who placed an order compared to customers who have made at least one purchase in the past.
Usage Of Product Analytics
- Find your best and the worst-performing product
- Strategize marketing campaigns around a particular product
- Create up-sell and cross-sell strategies for mild-selling products
Over To You
So these are the Shopify analytics metrics you can use to take your online business to the next level. We are hoping after reading this blog you can understand the nitty-gritty of Shopify analytics. In case you get stuck somewhere then don’t hesitate to reach out, we would be happy to help you. And we can also provide you with a Shopify app development service. For more information, kindly contact us.


About the author
Mehul Jagwani
Mehul is a content writer with a heart of nomad. He is currently working with Identixweb as a content writer and he is passionate about Quantum Mechanics, Christopher Nolan's movie and Traveling. His weekends are well spent with his Golden Retriever recharging him with cuddles and strolls.